Intro: The following plots show the location of meteor shower radiants as detected in near real-time by the MEO-sponsored multi-station Canadian Meteor Orbit Radar (CMOR). Each day approximately 4000-5000 individual meteoroid orbits are measured by CMOR - the amount of "clumpiness" in these radiants determines the location of individual showers. Groupings of radiants in location and speed are localized using a 3D wavelet transform technique and the associated showers listed by their three letter International Astronomical Union code
The top plot is in equatorial coordinates (right ascension and declination) while the bottom plot is in sun-centred ecliptic coordinates where the sun remains fixed at (0,0). Individual radiants are shown in these plots without speed information - wavelet maxima are localized both spatially and by speed so some regions which look densely populated may actually have a wide range of speeds and not be a shower and vice versa.
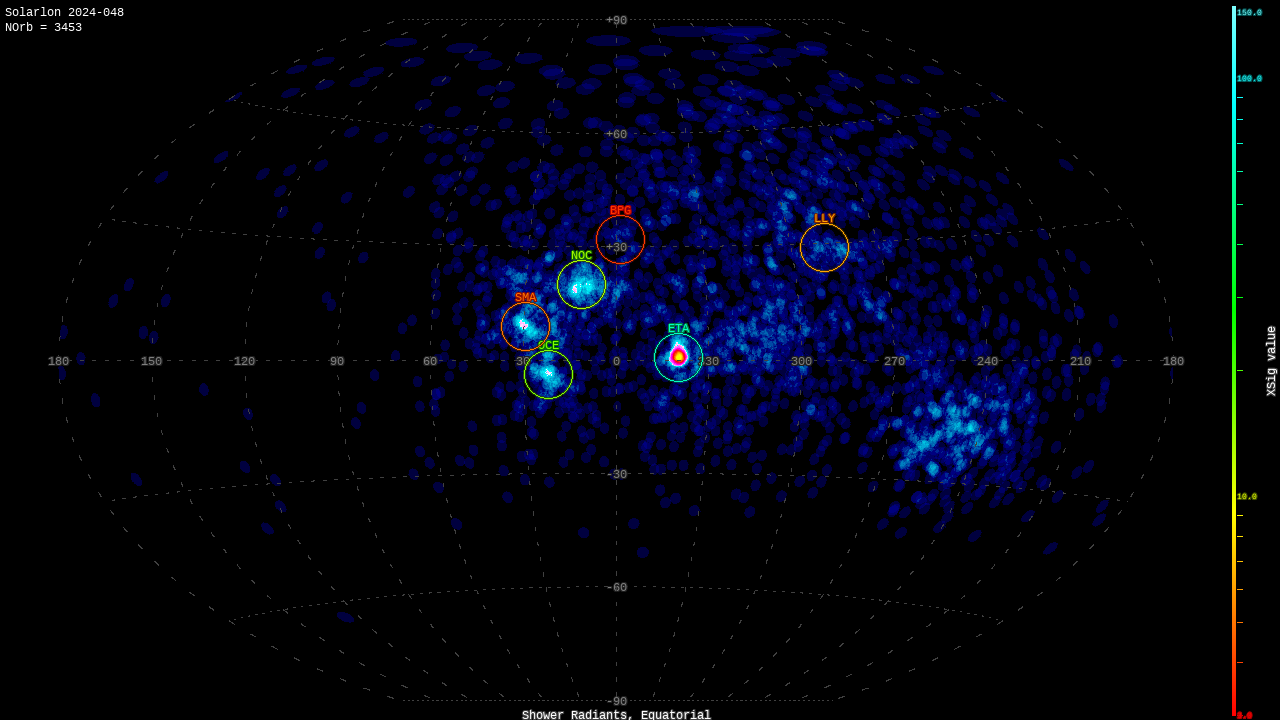
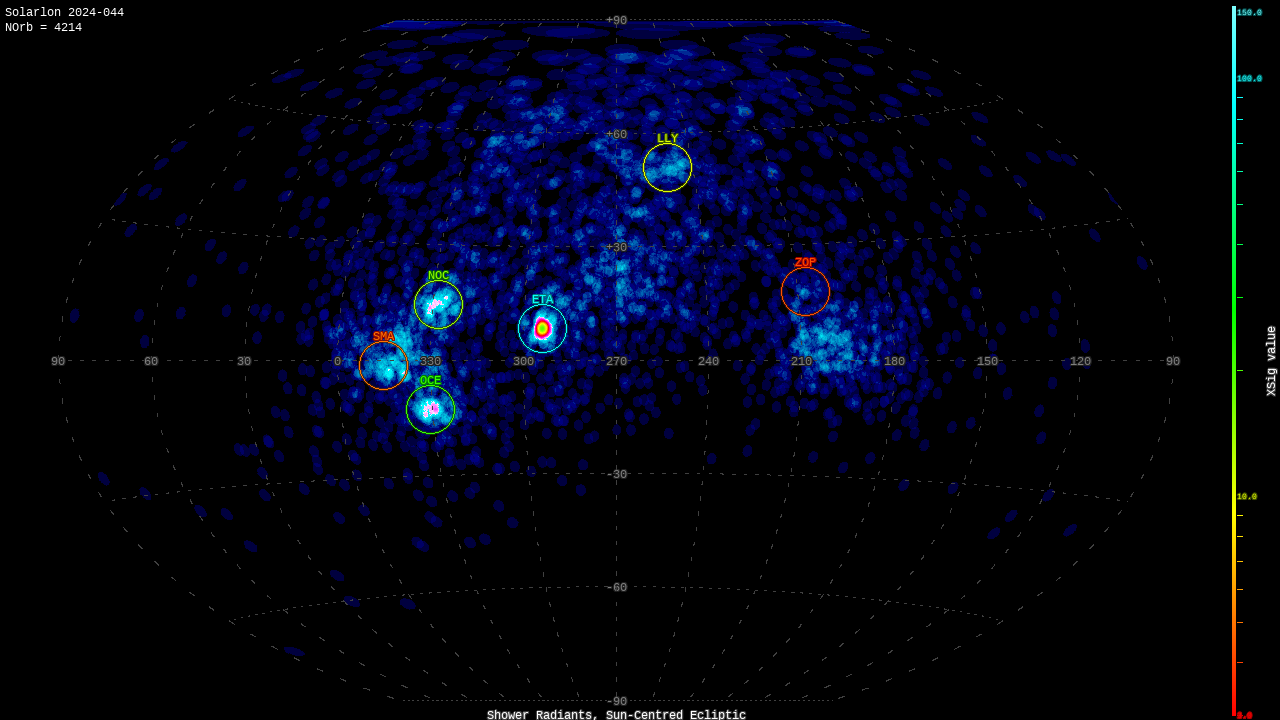
Analysis: The strength of each shower detection is color coded and given numerically by the xsig value. This value represents the number of standard deviations the radiant strength (as measured by the wavelet coefficient) is above the median background level for that particular location and speed averaged over the entire previous year. Additional details of this wavelet transform process applied to CMOR radiant data can be found in this article.
The roughly one day time period where data were gathered to generate this plot (in units of solar longitude) and equivalent date are given in the text header. The header also lists the average daily flux and equivalent average daily ZHR for the strongest showers where appropriate.
Details of the radar system can be found at The University of Western Ontario Meteor Physics Group.